KubeElasti
Serverless for Kubernetes
Automatically scale your services to zero when idle and scale up when traffic arrives.
KubeElasti saves cost using scale-to-zero without losing any traffic, requires no code changes, and integrates with your existing Kubernetes infrastructure.
Key Features
Cost Optimization
Scale to zero when there's no traffic to save resources and reduce costs
Zero Downtime
Queues requests during scale-up to ensure no traffic is lost
Simple Configuration
Easy setup with a single CRD and minimal configuration required
Seamless Compatibility
Works with your existing Kubernetes setup, HPA, and Keda
Out of Box Monitoring
Built-in monitoring with Prometheus metrics and Grafana dashboards
Request Preservation
Ensures all incoming requests are processed even during scale operations
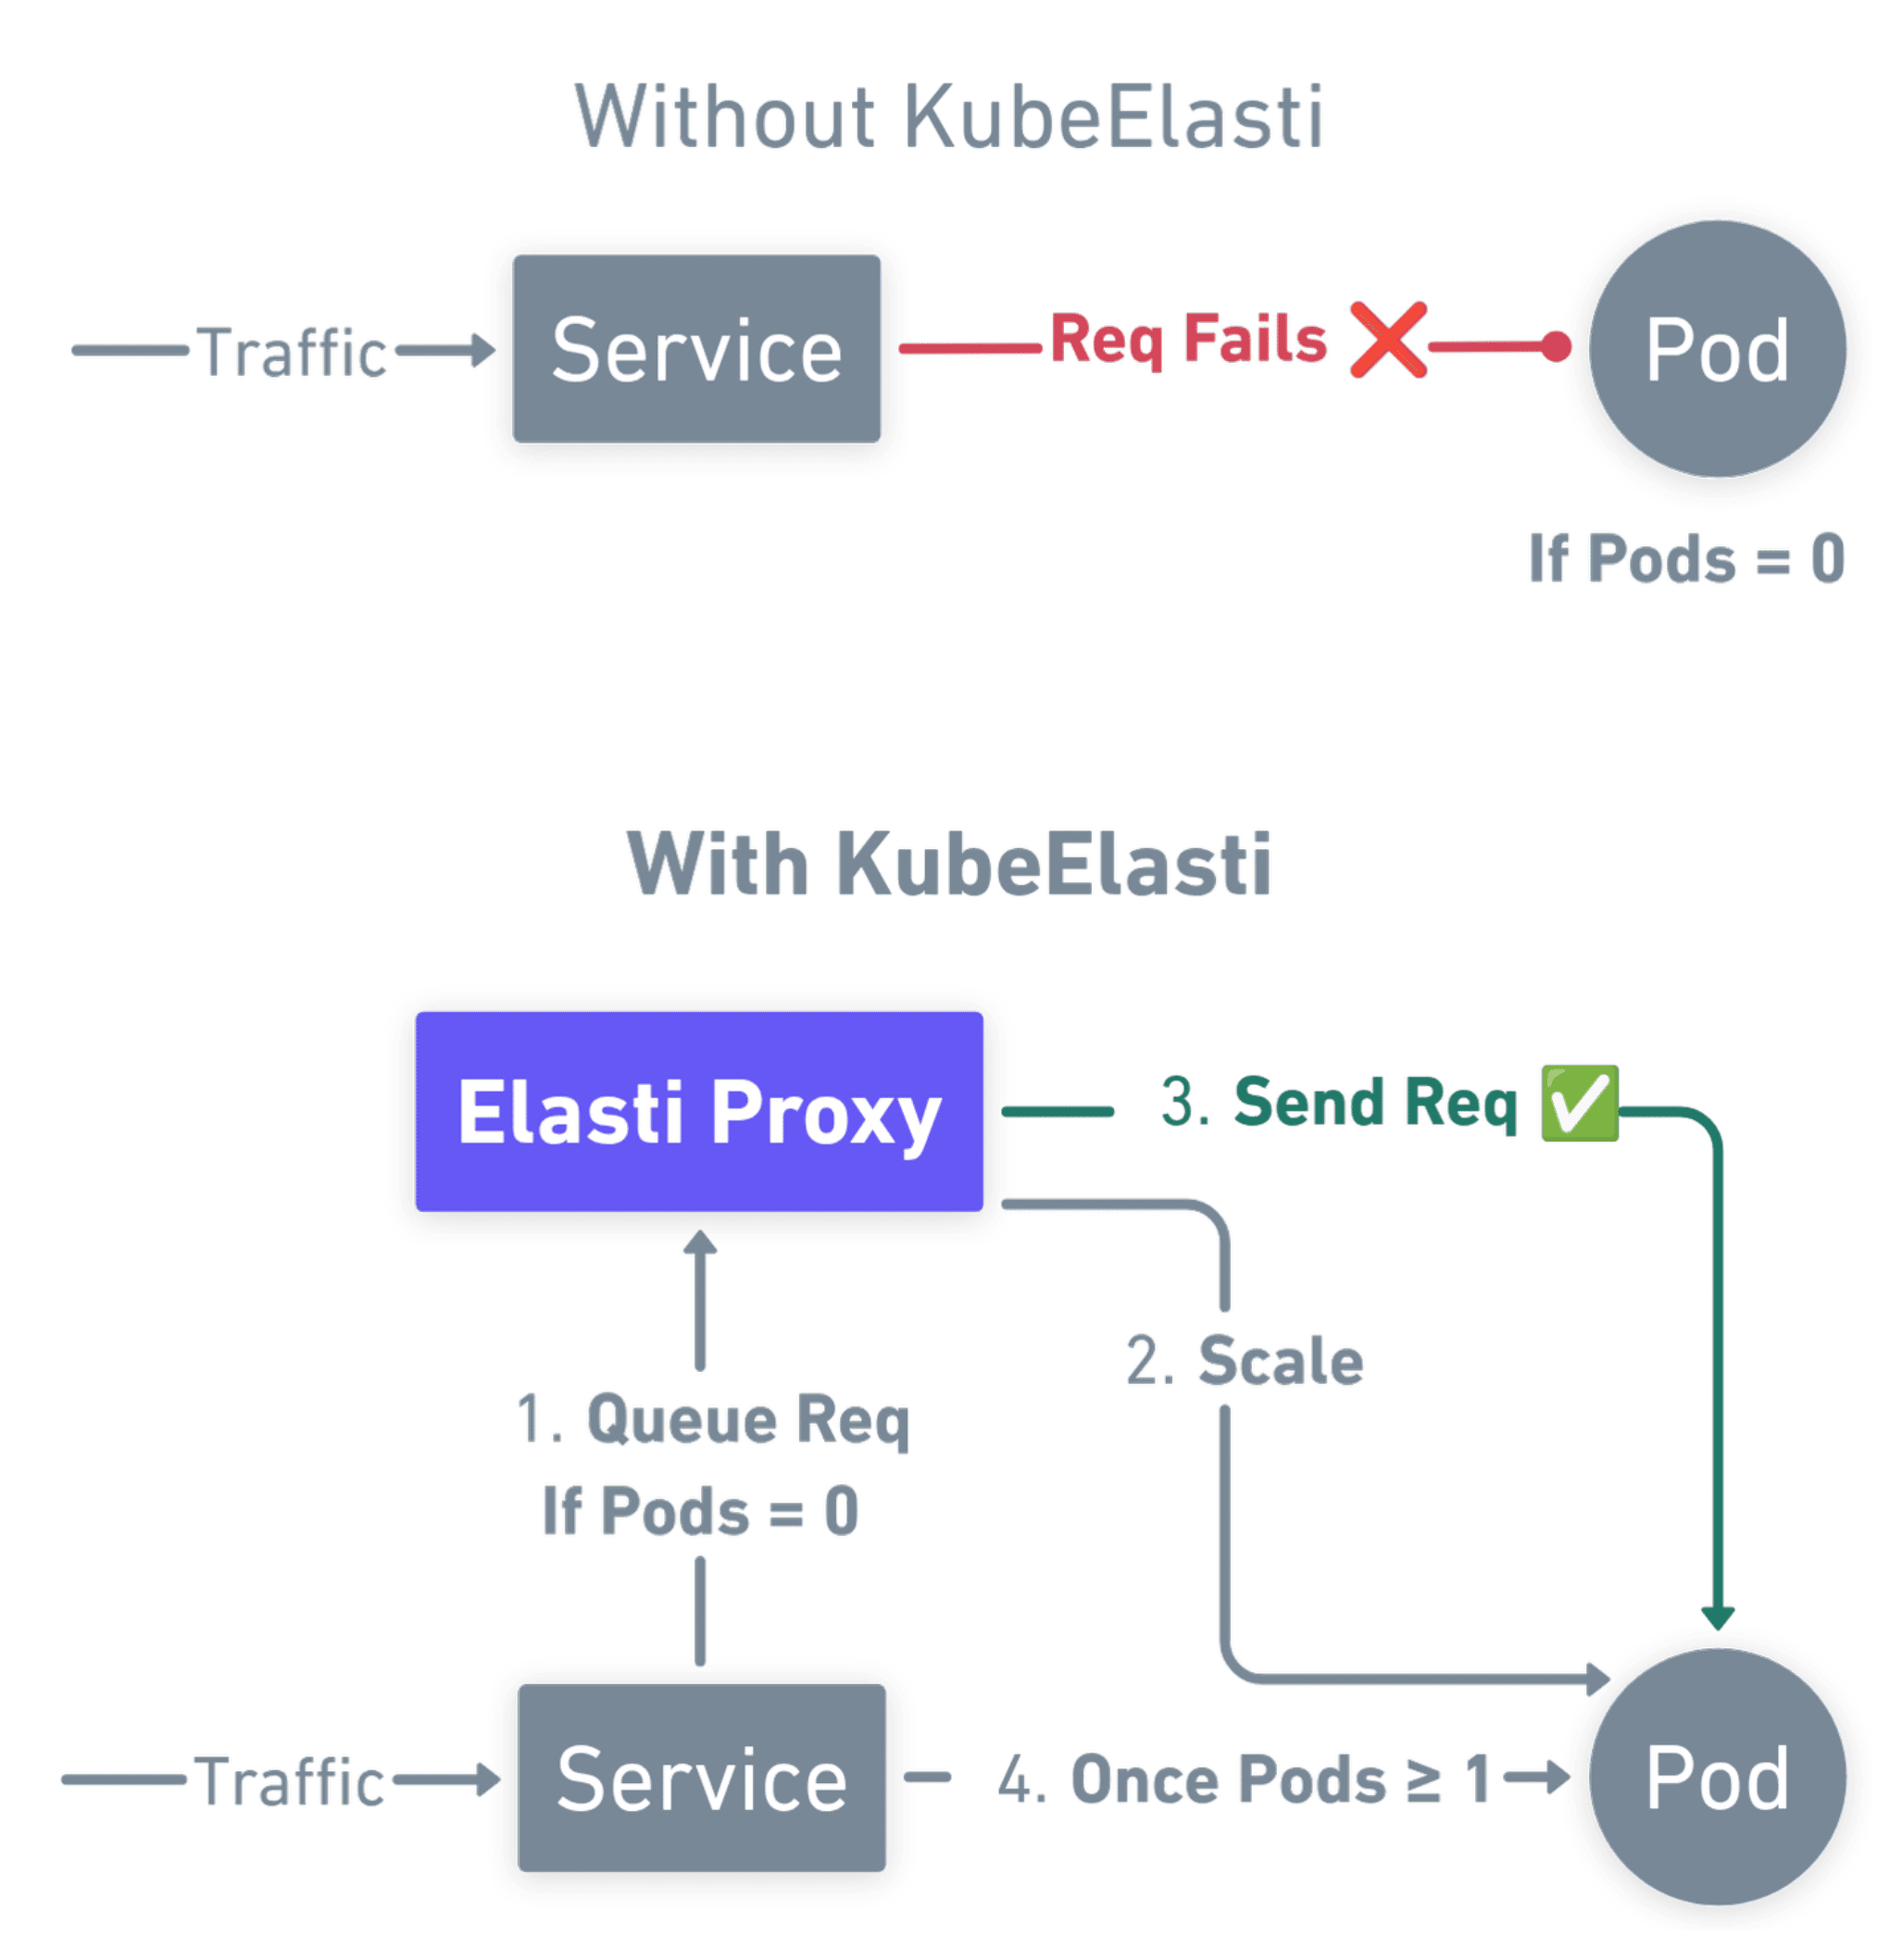
How It Works

Scaling Down
When all triggers indicate inactivity, KubeElasti scales the service to 0 replicas and switches to proxy mode
Traffic Queueing
In proxy mode, KubeElasti intercepts and queues incoming requests to the scaled-down service
Scaling Up
When traffic arrives, KubeElasti immediately scales the service back up to its minimum replicas
Serve Mode
Once the service is up, KubeElasti switches to serve mode and processes all queued requests
Serverless with just 1 File
# Create ElastiService CRD for the service you want to optimize
# Replace values between <> with actual values
kubectl apply -f - <<EOF
apiVersion: elasti.truefoundry.com/v1alpha1
kind: ElastiService
metadata:
  name: <TARGET_SERVICE>
  namespace: <TARGET_SERVICE_NAMESPACE>
spec:
  minTargetReplicas: 1
  service: <TARGET_SERVICE_NAME>
  cooldownPeriod: 5
  scaleTargetRef:
    apiVersion: apps/v1
    kind: deployments
    name: <TARGET_DEPLOYMENT_NAME>
  triggers:
    - type:   prometheus
      metadata:
        # Select a trigger metric to monitor
        query: sum(rate(nginx_ingress_controller_nginx_process_requests_total[1m])) or vector(0)
        # Replace with the address of your Prometheus server
        serverAddress: http://kube-prometheus-stack-prometheus.monitoring.svc.cluster.local:9090
        threshold: "0.5"
EOF

# 🎉 That's it! You just created a scale-to-zero service
KubeElasti is easy to set up and configure. Follow our step-by-step guide to get started.
Full Installation GuideDemo - See KubeElasti in action!
Join Our Community
Get help, share your experience, and contribute to KubeElasti